


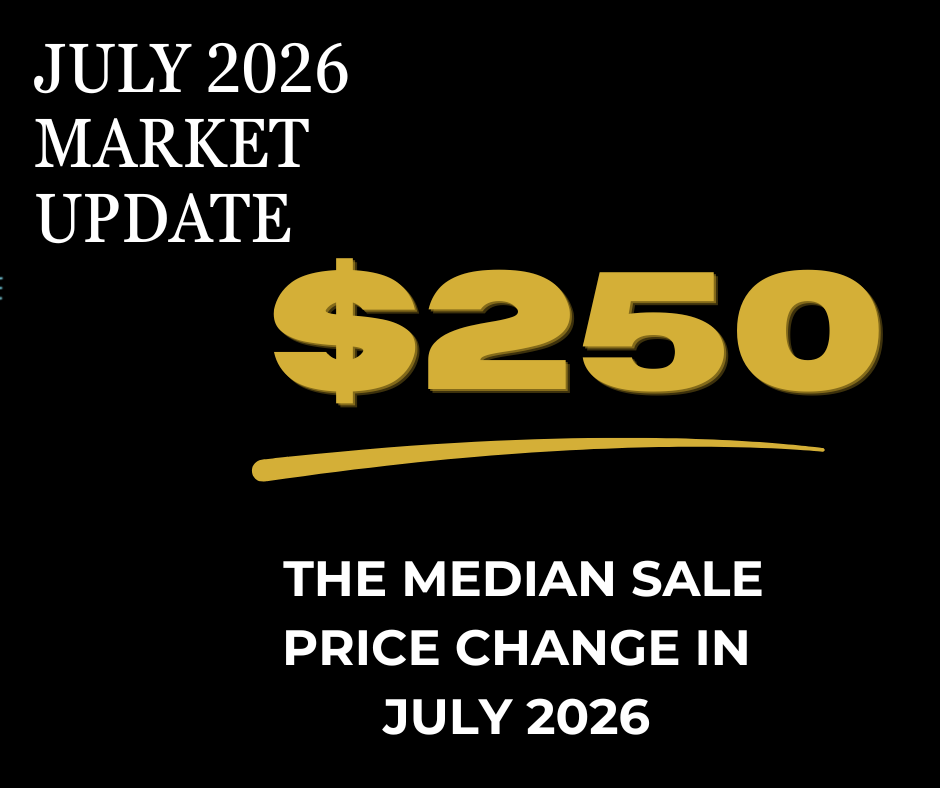
We pulled the July numbers for Monmouth and Ocean County this week and found something we have not seen in a while. The median sale price moved by $250.
Not $2,500. Not $25,000. Two hundred and fifty dollars.
In June, the median home in our two counties sold for $606,250. In July, it sold for $606,500. If you own a typical house around here, the market did almost literally nothing to your value last month.
That is not a bad thing. It is just a very different thing from what the averages will tell you, and it is worth twenty minutes of your attention if you are thinking about a move this fall.
Where the movement actually was
While the median sat still, the average sale price fell from $801,515 to $742,054. That is a drop of 7.4% in a single month.
When the median holds and the average falls, it means the top of the market got quieter. Fewer of the very large sales closed in July than in June, and those big numbers are what pull an average upward. Take a few of them out and the average drops while the typical house never flinches.
So if you own a $600,000 house, nothing happened to you in July. If you own a $2 million waterfront property, something did, and it is worth a real conversation rather than a headline.
This is the single most common way people misread market data, and it costs sellers money. The average is not the middle. The average is the middle plus whatever the extremes are doing.
Inventory is building, and sales are not
Here is the part that will matter more by October.
Active listings went from 3,791 in June to 4,054 in July, up about 7%. New listings rose from 2,110 to 2,276, also up about 7%.
Closed sales went from 1,638 to 1,636. Two fewer homes. Flat.
More houses came on, more houses stayed on, and the same number sold. Months of inventory moved from 2.31 to 2.48.
Now, some of that is just July. Summer at the shore is not when this market does its best work, and one month is not a trend. We are not going to tell you the sky is shifting based on thirty days of data.
But the direction is worth watching. If new listings keep outpacing sales into September, the fall market looks different than the spring one did.
The number we would circle
Two figures in this report, sitting right next to each other.
Homes sold for an average of 100.6% of list price in July.
Homes sold for an average of 99.3% of original list price.
That gap is the whole ballgame.
The first number says sellers got a little more than they were asking. The second says they got a little less than they started out asking. The difference between those two is price reductions, and in July the average price cut on an active listing was about $48,800, roughly 5.9% off.
Translate that to a kitchen table. If you price your home correctly on day one, you are likely to get every dollar of it and maybe a bit more. If you price it high and let the market correct you, you will spend a few weeks finding out, cut something in the neighborhood of $48,000, and finish below where a correct price would have landed you.
Same house. Same market. Roughly a $48,000 difference in outcome, decided entirely in the first week.
And homes are slowing down slightly
Median days on market went from 17 in June to 20 in July. Average days went from 32 to 35.
Twenty days is still fast by any reasonable standard. But notice the gap again between the median of 20 and the average of 35. Half of everything sold in under three weeks. A long tail of homes sat much longer and dragged the average up.
There is no typical 35 day listing. There are homes that go in two weeks and homes that sit for months, and which one you become is mostly decided by price, not by luck or season.
One tension worth naming
Sellers currently on the market raised their asking prices. The median list price of active homes went from $610,000 in June to $617,000 in July.
Meanwhile, homes that went under contract had a median list price of $589,000, down from $599,000.
So asking prices went up, and the homes actually finding buyers were the ones asking less. That is not a crisis. It is a gap between what sellers hope and what buyers are signing, and gaps like that usually close in one direction.
What we would tell you
Selling this fall. Price it right in week one. The 100.6% versus 99.3% gap is not academic, it is about $48,000 of your money.
Buying. You have roughly 260 more homes to choose from than you did in June, and sales are flat. That is a better negotiating position than you had at the start of summer, especially above $700,000 where the top end got quieter.
Just curious what your house is worth. The median did nothing last month. That is genuinely useful information, and it means you have not missed anything by waiting.
The market in July was steady in the middle and softer at the top. That is the honest read, and it is more useful than any headline about prices being up or down.
If you want to know which part of that your house sits in, that is a short conversation and we are glad to have it.
Source: Monmouth Ocean Regional MLS Market Trends, Residential, Monmouth and Ocean Counties, pulled August 3, 2026. Comparisons are June 2026 to July 2026. July closings reported after the pull date are not reflected.
Check out this article next